We all share the experience of aging. We’re here to guide you along the way.
Alliance for Aging Research home page
Latest Updates
View up-to-date news, current events, and advancements in aging and health.
 Impact Report 2023: Changing the Narrative to Achieve Healthy Aging and Equitable Access
Impact Report 2023: Changing the Narrative to Achieve Healthy Aging and Equitable Access
Read Second Transcatheter Therapy for the Treatment of Tricuspid Valve Regurgitation Approved by the FDA
Second Transcatheter Therapy for the Treatment of Tricuspid Valve Regurgitation Approved by the FDA
Read Podcast: Understanding Patient Perspectives with Carrie Shaw
Podcast: Understanding Patient Perspectives with Carrie Shaw
Tune InFind-A-Topic
- Alzheimer’s Disease and Related Dementias
- Antimicrobial Resistance
- Appropriations
- Cardiovascular Disease
- Care Innovation and Access
- Clinical Trials
- COVID-19
- Family Caregiving
- Health Equity
- Healthy Aging
- Home Health and Community-Based Services
- Medicaid
- Medicare
- Mental Health
- Nursing Home and Post-hospital Care
- Nutrition
- Persistent Pain
- Prescription Drug Affordability
- Quality and Outcomes
- Research Funding
- Sarcopenia and Mobility
- Telehealth
- Vaccination
- Value Assessment and Pricing
- Vision Loss
News & Updates
Videos

Real Stories of Vaccine-Preventable Diseases: Allison’s Experience with Influenza (“Flu”)
While most of us have had the flu or know someone who has had it, we often do not realize…
more.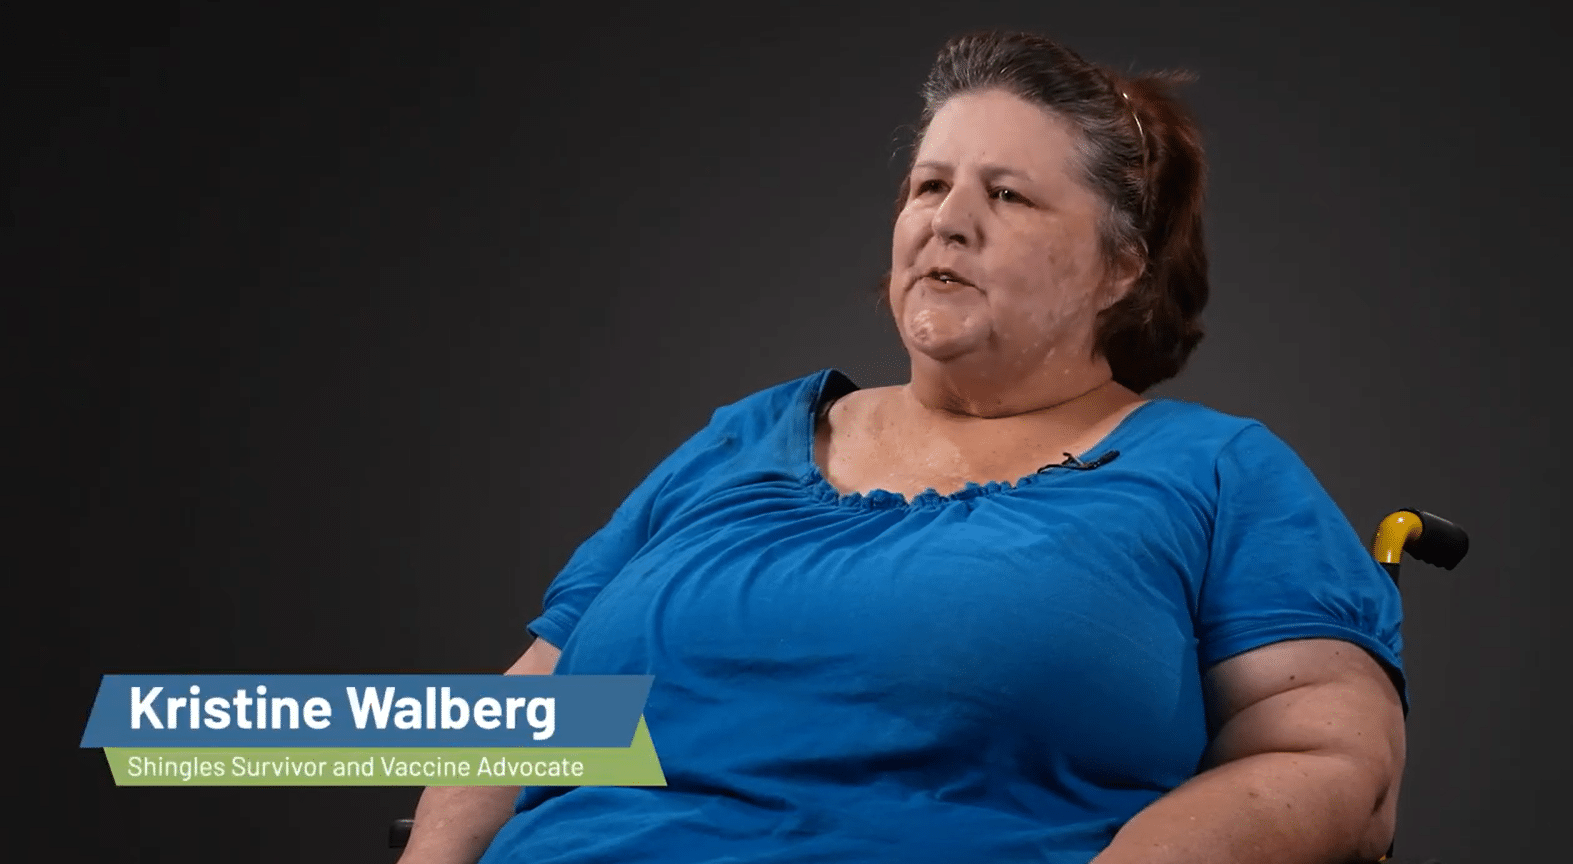
Real Stories of Vaccine-Preventable Diseases: Kristine’s Experience with Shingles
Shingles is caused by the varicella-zoster virus, or VZV, which is the same virus that causes chickenpox. The virus…
more.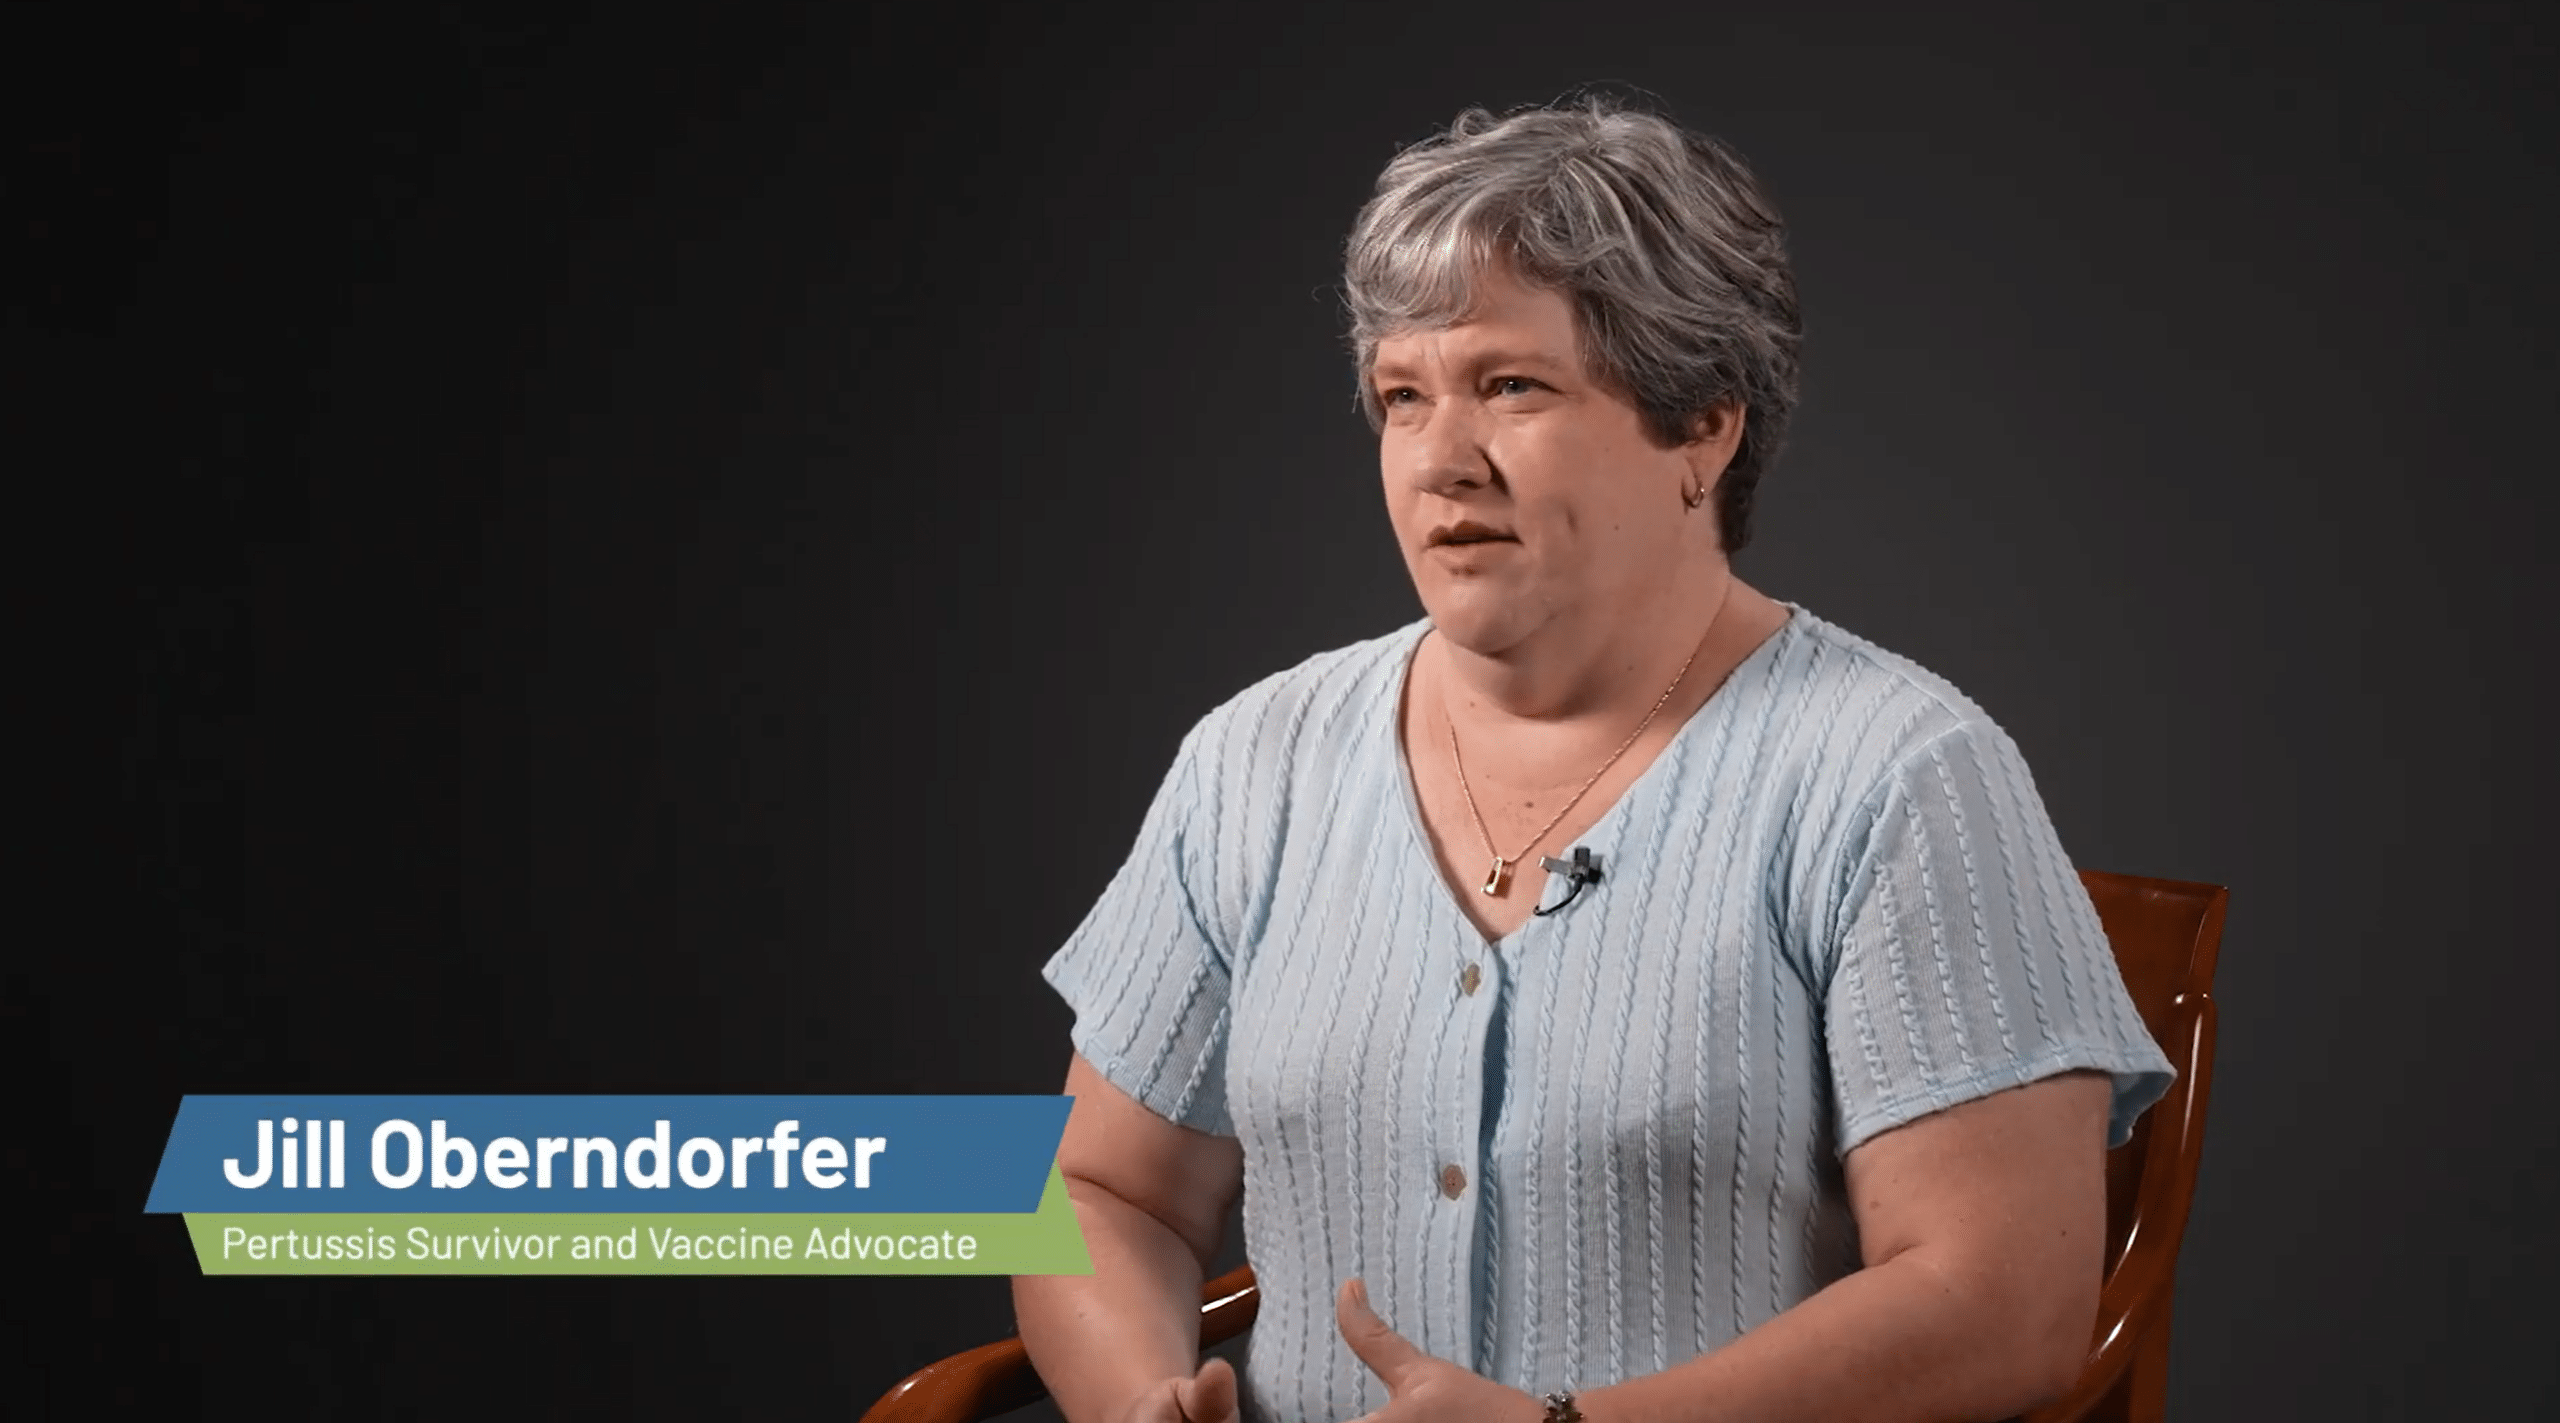
Real Stories of Vaccine-Preventable Diseases: Jill’s Experience with Pertussis
Pertussis, also known as whooping cough, is a severe infection of the upper respiratory system caused by bacteria. It can…
more.This is Growing Old
- 73: Understanding Patient Perspectives with Carrie Shaw
- 72: Becoming Your Own Advocate with Heart Disease Survivor Robyn Peacock
- 71: Looking Ahead with Alliance Board Chair Michele Markus
- 70: Boosting Your Holidays with Vaccination Resources
- 69: Navigating Neuropsychiatric Symptoms with Terrie Montgomery

Aging Research Initiatives
Learn more about our efforts to raise awareness and advocate for research around conditions that impact aging Americans.
Heart Valve Disease Awareness Day
The Heart Valve Disease Awareness Day campaign was started to increase recognition of the specific heart valve disease risks and symptoms, improve detection and treatment, and ultimately save lives. Heart Valve Disease Awareness Day takes place every February 22 during American Heart Month.
Alzheimer’s Disease Policy Task Force
The Alzheimer’s Disease Policy Task Force is an ad hoc coalition of patient, family caregiver, and professional organizations, working collectively to organize and educate the Alzheimer’s disease community and decisionmakers on the Food & Drug Administration’s (FDA) Accelerated Approval pathway, and the Centers for Medicare & Medicaid Services’ (CMS) coverage determination processes for amyloid-targeted monoclonal antibody therapies for the treatment of Alzheimer’s disease.
Talk NERDY
The Talk NERDY (Nurturing Engagement in Research and Development with You) program empowers older adults, their family caregivers, clinicians, and health researchers to learn about patient-centered outcomes research (PCOR) and how we can all work together to develop – and implement – research that answers the questions that matter most to patients.
Ways to Give
There are many ways you can help accelerate the pace of scientific discoveries and their application to vastly improve the universal human experience of aging and health:

The Alliance for Aging Research is a proud recipient of Candid’s Platinum Seal of Transparency.
The Alliance for Aging Research is proud to be rated a 4-star charity by Charity Navigator.
Living Longer and Loving It
Sign up for our monthly e-mail newsletter for the latest information on
scientific research on aging and health.